On this page
- Why this matters now
- The trace shape to standardize on
- Implementation details that survive production
- A rollout plan for senior engineering teams
- Pitfalls and tradeoffs
- Concrete takeaways
- FAQ
- Should we capture prompts in production traces?
- Do we need OpenTelemetry if our framework already has tracing?
- How should MCP tool calls appear in an agent trace?
- Which metrics should we add first?
- References
Production agents need traces that explain the whole turn: model calls, planning, tool execution, MCP hops, token use, retries, and privacy choices. The current OpenTelemetry GenAI work gives teams a portable schema for that runtime view, but its Development status means you should adopt it deliberately, behind versioned instrumentation.
Why this matters now
The operational failure mode for agents is no longer a single slow API request. It is a chain of decisions. One user turn can invoke a planner, call a model twice, route through an MCP server, execute a datastore tool, compact context, retry after a provider error, and then return an answer that looks deceptively simple. OpenTelemetry describes GenAI spans as logical operations observed by the caller, and those spans should cover retries until the response is fully received or the operation terminates OpenTelemetry GenAI spans.
That matters because most agent incidents are questions about causality. Was latency caused by the model, a slow tool, streaming time to first chunk, or a retry loop? Was cost caused by prompt bloat, cache misses, or a tool result injected back into the next model call? Did the final answer use the approved retrieval source, or did the planner choose a different path? The OpenTelemetry GenAI repository now explicitly covers spans, metrics, events, MCP, and provider-specific conventions for systems such as OpenAI OpenTelemetry GenAI repository.
The important shift is that traces become an interface. They are the contract between your agent runtime, your observability backend, your eval pipeline, your security review, and your incident process. If that contract is proprietary, every framework migration reopens the same work. If it is portable, the team can change frameworks while keeping the same operational questions answerable.
The trace shape to standardize on
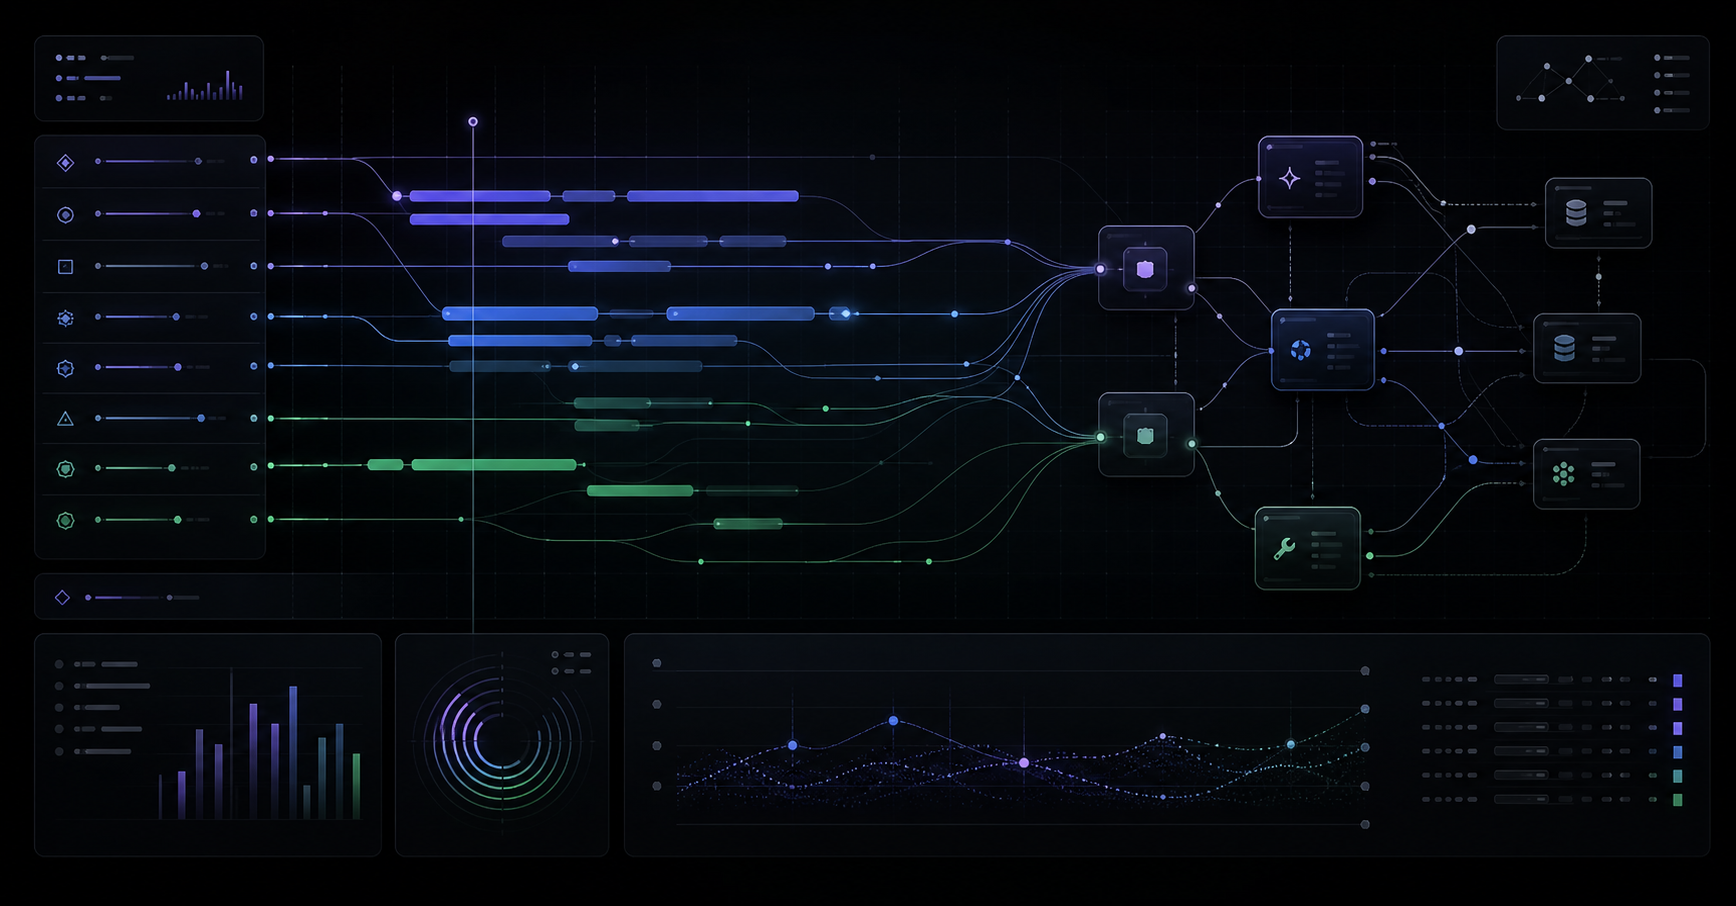
A useful agent trace starts with the user-visible unit of work. In most products, that is one agent turn, workflow invocation, or background job. Under that root, use spans for the planner, each model call, each tool call, each MCP client and server hop, and any evaluator or guardrail that changes the outcome. The OpenTelemetry agent span conventions define agent-facing operations such as invoke_agent, invoke_workflow, plan, and execute_tool OpenTelemetry GenAI agent spans.
graph TD
  A["agent turn"] --> B["plan"]
  B --> C["chat model call"]
  B --> D["MCP tools/call"]
  D --> E["tool server"]
  E --> F["datastore or API"]
  A --> G["guardrail"]
  A --> H["final model call"]
  H --> I["response"]
A model span should carry stable metadata first: gen_ai.operation.name, gen_ai.provider.name, gen_ai.request.model, gen_ai.response.model, finish reasons, token usage, and streaming timing when available OpenTelemetry GenAI spans. The OpenAI-specific convention requires gen_ai.provider.name to be openai for OpenAI client operations and adds OpenAI attributes such as openai.api.type, service tier, and system fingerprint OpenTelemetry OpenAI conventions.
A tool span should answer a different question: what capability was invoked, how long did it take, did it fail, and what low-cardinality class of failure occurred? The GenAI metrics document includes gen_ai.execute_tool.duration for the duration of a single tool execution and recommends recording it when instrumentation can reliably bound a tool call OpenTelemetry GenAI metrics.
For MCP, do not rely on HTTP spans alone. MCP runs over JSON-RPC and can multiplex logical requests through transports in ways that HTTP trace context does not describe. The MCP convention recommends injecting OpenTelemetry context into params._meta with traceparent, tracestate, and baggage, then extracting that context on the receiver as the remote parent OpenTelemetry MCP conventions.
{
  "jsonrpc": "2.0",
  "method": "tools/call",
  "params": {
    "name": "customer_lookup",
    "_meta": {
      "traceparent": "00-4bf92f3577b34da6a3ce929d0e0e4736-00f067aa0ba902b7-01",
      "baggage": "tenant=acme,env=prod"
    }
  },
  "id": 42
}
Implementation details that survive production
Start with a collector boundary, not a dashboard choice. Emit OTLP from your agent process to an OpenTelemetry Collector, then fan out to your preferred backend. LangSmith documents both automatic tracing for LangChain and LangGraph via LANGSMITH_OTEL_ENABLED=true and manual OTLP export for non-LangChain applications LangSmith OpenTelemetry docs. OpenAI's Agents SDK has built-in tracing for runs, model generations, tool calls, handoffs, guardrails, transcription, and speech spans, and it supports custom processors for alternate or additional destinations OpenAI Agents SDK tracing. Teams under OpenAI Zero Data Retention should note the SDK documentation says OpenAI-hosted tracing is unavailable for ZDR organizations, so those deployments need a separate export path OpenAI Agents SDK tracing.
A minimal rollout does not need every attribute. It needs the attributes that preserve operational meaning with low risk:
| Layer | Required first | Add after policy review |
|---|---|---|
| Agent turn | trace id, workflow name, conversation id, agent name | prompt version, agent version, tenant metadata |
| Model call | provider, requested model, response model, token counts, finish reason, latency | input messages, output messages, tool definitions |
| Tool call | tool name, tool type, duration, error type | arguments, result, redacted resource identifiers |
| MCP call | method, request id, session id, protocol version, propagated trace context | resource URI, prompt variables, sanitized tool payloads |
| Evaluation | score label, score value, metric name | evaluator explanation and linked response id |
The table is intentionally staged because prompt content is not ordinary telemetry. The GenAI span convention says model instructions, user messages, and outputs are sensitive and often large. Instrumentations should not capture them by default, and application developers should either avoid recording them, opt in for controlled environments, or store content externally and put references on spans when production volume and access control matter OpenTelemetry GenAI spans.
A practical policy is to split telemetry into three classes. Class one is safe operational metadata: model names, latency, token counts, error types, and routing decisions. Class two is redacted business context: tenant, workflow, prompt version, tool name, and retrieval source identifiers. Class three is content: prompts, completions, tool arguments, tool results, and system instructions. Class three needs opt-in capture, retention limits, access controls, and a deletion path.
OpenTelemetry events are also relevant when you need content-like detail without overloading span attributes. The GenAI events convention defines gen_ai.client.inference.operation.details as an opt-in event that can store request and response details independently from traces, and it defines gen_ai.evaluation.result for quality, accuracy, or other evaluation results OpenTelemetry GenAI events.
A rollout plan for senior engineering teams
First, instrument the root turn and model spans. Do this before debating backend UI. You want every request to answer four questions: which workflow ran, which model was requested, how many input and output tokens were billed, and how long the model operation took. The GenAI metrics convention includes gen_ai.client.token.usage for input and output token histograms and gen_ai.client.operation.duration for operation latency OpenTelemetry GenAI metrics.
Second, connect tools and MCP hops. Treat each tool as an operational dependency with a bounded duration, low-cardinality error type, and stable name. When the tool is served through MCP, propagate context through params._meta, not just HTTP headers, because the MCP convention explains that HTTP context and MCP message context are independent OpenTelemetry MCP conventions.
Third, add sampling rules at span creation time. The GenAI span docs call out attributes such as operation name, provider name, request model, server address, and agent name as important for sampling decisions when they are provided OpenTelemetry GenAI spans. Put those attributes on the span early so the SDK or collector can keep high-value traces without storing every low-risk success path.
Fourth, wire traces into evaluations. OpenTelemetry's agent observability blog notes that agent telemetry can act as a feedback loop for evaluation tools, not just monitoring dashboards OpenTelemetry AI Agent Observability. In practice, that means saving trace ids with eval results and saving evaluator events with response ids. When a regression appears, you should be able to open the exact trace tree that produced it.
Fifth, make framework-specific tracing coexist with OTel. OpenAI Agents SDK tracing is useful out of the box, but it also includes custom trace processors and defaults that may not fit every data policy OpenAI Agents SDK tracing. OpenInference offers another AI-specific schema built on OpenTelemetry with span kinds such as LLM, AGENT, TOOL, RETRIEVER, GUARDRAIL, EVALUATOR, and PROMPT OpenInference specification. The production pattern is not to pick one dashboard forever. It is to preserve enough semantic meaning that traces can move.
Pitfalls and tradeoffs
The first pitfall is assuming Development means unusable. It means moving. At publication time, the OpenTelemetry GenAI docs are marked Development, so production users should pin instrumentation versions, track convention changes, and avoid hard-coding dashboard queries that cannot tolerate renamed attributes OpenTelemetry GenAI overview. Do not wait for perfect stability if you are already debugging agents by reading raw logs. Start with low-risk metadata and keep the adapter layer small.
The second pitfall is duplicate spans. MCP tool spans can be compatible with GenAI execute_tool spans, and the MCP convention says instrumentation should avoid creating a separate span when outer GenAI instrumentation is already tracing tool execution and can add MCP-specific attributes to the existing span OpenTelemetry MCP conventions. Duplicate spans make traces look busier while making ownership less clear.
The third pitfall is content capture by default. The 2026 OpenTelemetry GenAI observability walkthrough notes that prompt content and tool arguments are not captured by default because they can contain sensitive data OpenTelemetry GenAI observability blog. If an incident requires content, enable it for a narrow environment, a limited sample, or a secure external content store. Do not turn your trace backend into a shadow prompt database by accident.
The fourth pitfall is high-cardinality naming. Span names should be stable enough to aggregate. Put user ids, resource URIs, and arbitrary prompt text in attributes only when the convention recommends it and your backend can tolerate it. MCP specifically warns against including resource URI in the span name by default because it can be high cardinality OpenTelemetry MCP conventions.
The fifth pitfall is treating token metrics as exact cost accounting before you understand provider semantics. The metric convention says token usage should be reported when count is readily available, and when systems report both used and billable tokens, instrumentation must report billable tokens OpenTelemetry GenAI metrics. Use the metric for budgets and regressions, then reconcile against invoices for finance-grade reporting.
Concrete takeaways
Rollout checklist: pick one root span per user-visible turn, add model and token metadata, connect tool and MCP spans, keep content capture opt-in, and route OTLP through a collector before committing to a dashboard.
Adopt a portable trace taxonomy before the agent stack hardens. Root every user-visible turn. Represent planner, model, tool, MCP, guardrail, and evaluation work as first-class spans. Record token and duration metrics from day one. Keep prompts and tool payloads out of default telemetry. Propagate context through MCP params._meta. Pin convention versions and make changes through a small instrumentation adapter.
The teams that get this right will debug agent behavior by opening a trace, not by replaying logs, guessing from final answers, or arguing over which framework owns the truth. For production agents, observability is becoming part of the runtime contract.
FAQ
Should we capture prompts in production traces?
Not by default. The OpenTelemetry GenAI convention says instructions, inputs, and outputs are sensitive and often large, so instrumentations should not capture them by default and should provide opt-in capture OpenTelemetry GenAI spans. Use metadata first, then add controlled content capture only where policy allows it.
Do we need OpenTelemetry if our framework already has tracing?
Yes, if you want portability across frameworks, backends, and evaluation tools. Framework tracing is still useful, and OpenAI's Agents SDK traces model generations, tool calls, handoffs, and guardrails by default OpenAI Agents SDK tracing. The point of OpenTelemetry is to avoid making that framework trace format your only operational interface.
How should MCP tool calls appear in an agent trace?
An MCP tool call should appear as a tool execution in the agent trace with MCP-specific attributes such as method name, request id, session id, protocol version, and transport details where available OpenTelemetry MCP conventions. Propagate W3C trace context through params._meta so client and server spans remain connected.
Which metrics should we add first?
Start with operation latency, token usage, agent invocation duration, and tool execution duration. The GenAI metrics convention defines histograms for client token usage, client operation duration, workflow duration, invoke-agent duration, and execute-tool duration OpenTelemetry GenAI metrics. Those metrics catch the most common production regressions before you build specialized dashboards.
References
- OpenTelemetry GenAI Semantic Conventions repository
- OpenTelemetry GenAI overview
- OpenTelemetry GenAI model spans
- OpenTelemetry GenAI agent spans
- OpenTelemetry GenAI metrics
- OpenTelemetry MCP conventions
- OpenTelemetry GenAI events
- Inside the LLM Call: GenAI Observability with OpenTelemetry
- AI Agent Observability: Evolving Standards and Best Practices
- OpenAI Agents SDK tracing
- LangSmith Trace with OpenTelemetry
- OpenInference Specification